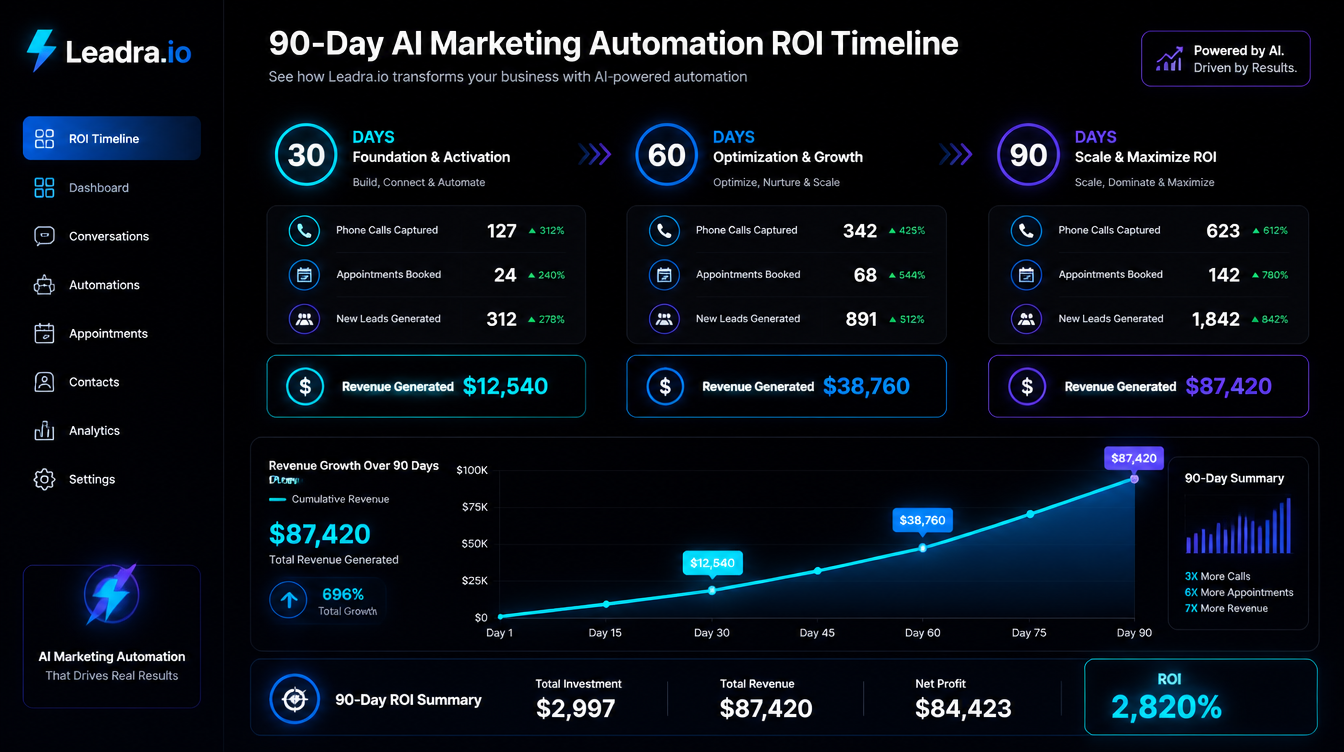
The most common reason small businesses write off AI marketing automation as a failure? They quit on day 47.
Not because it was not working. Because they were looking at the wrong metrics during the wrong phase. AI marketing automation does not deliver its full return on day one — it builds in layers, and each layer compounds the one before it. Businesses that understand the 30-60-90 day arc stay in long enough to see real AI marketing automation ROI. Businesses that do not understand it bail during the setup phase and conclude it "did not work."
At Leadra.io, we have deployed AI marketing automation systems for dozens of small businesses in Charlotte, NC and across the US. The timeline below is not theoretical. It is built from real deployment data: what actually moves in month one, what accelerates in month two, and where the compounding effect hits in month three.
If you are asking what ROI you can expect from AI marketing automation — here is the honest, phase-by-phase answer.
Why AI Marketing Automation ROI Builds in Phases
Traditional marketing spend — Google Ads, Facebook campaigns — can show returns in days. You spend $500, you get calls, you book jobs. The feedback loop is fast and the math is simple.
AI marketing automation works differently. It activates multiple revenue levers simultaneously, but each lever has its own ramp-up time. Lead capture improvements happen immediately. Reactivation revenue builds over 4-8 weeks as the campaign runs through your dormant customer list. Review velocity improvements take 45-90 days to translate into measurable Google ranking changes. SEO content takes 60-120 days to index and attract organic traffic.
The business that bails after 30 days captures only the lead-capture layer. The business that stays through 90 days gets all four layers running and compounding each other. That is the difference between 2x ROI and 8x ROI — and it is almost entirely determined by patience, not by the quality of the automation.
Days 1-30: The Foundation Phase
The first 30 days are about plugging the leaks. Most small businesses are already generating enough inbound interest to justify their current ad spend — they are just losing 30-50% of it before it converts. Month one stops that bleeding.
AI voice employee goes live (Week 1).
After-hours calls stop hitting voicemail and start getting answered. For a business that receives 25-40 inbound calls per month, 15-20% typically arrive outside business hours. An AI voice employee captures those leads instantly, collects the appointment request, and triggers a booking flow. Week one typically adds 3-6 captured leads that would have been permanently lost.
Instant follow-up sequence fires on all new leads (Week 1-2).
Every web form submission, Google Business Profile inquiry, and social media DM now gets an immediate SMS response — within 90 seconds, not 4 hours. Speed to response is the single biggest lever in lead conversion. Businesses that respond within 5 minutes are 21x more likely to connect with a lead than businesses that respond within 30 minutes. This change alone lifts lead-to-booking conversion by 15-25% in the first two weeks.
First reactivation campaign launches (Week 2-3).
Your existing customer list — everyone who bought from you in the last 2-5 years but has not been back — gets a targeted outreach sequence. A personalized SMS or email referencing their last visit or purchase, with a specific offer relevant to where they are in the customer lifecycle. A 10-12% response rate is typical on the first campaign. For a list of 300 dormant customers, that is 30-36 reactivated relationships.
Automated review requests begin (Week 2).
Every completed service triggers an automated review request — sent at the right moment (typically 24 hours post-service) via SMS with a direct Google review link. This is not asking for reviews in bulk; it is systematic post-service collection. Month one typically adds 8-15 new Google reviews for businesses that were previously generating 1-2 per month organically.
Days 1-30 — Typical Revenue Impact
Additional leads captured
6-15/mo
Reactivated customers (first wave)
12-30
Estimated revenue added (month 1)
$1,800-$5,200
Based on Leadra.io client data across dental, HVAC, and home service businesses. Results vary by industry and lead volume.
Days 31-60: The Momentum Phase
Month two is where the system starts showing up in your revenue report in a way that feels different from month one. The reactivation list is being worked systematically. The review count has climbed noticeably. And you have 30 days of real performance data to optimize against.
Review velocity creates early Google ranking signals.
By day 45-60, businesses that started with under 30 reviews typically cross 45-60 total reviews with an improved average rating. Google's local ranking algorithm weighs recent review velocity heavily — businesses actively generating reviews rank above older, more established businesses that stopped collecting. Early organic call volume lifts of 8-15% are measurable by the end of month two.
Second reactivation wave closes higher-value customers.
The automated system works through different segments of your dormant list in month two — targeting higher-LTV customers with tailored offers based on their service history. Response rates on the second wave average 7-9% (lower than the first wave's fresh-list bump, but still converting). Combined with month one reactivations who are now returning for follow-up visits, month two reactivation revenue is typically 30-50% higher than month one.
Lead conversion rate data enables optimization.
After 30 days of real data, Leadra.io reviews which follow-up sequences are converting, which time windows generate the best response rates, and where the AI voice employee is losing conversations. Small adjustments in message timing and script logic at the 30-day mark typically lift conversion rate an additional 8-12% in month two. This is not guesswork — it is data-driven tuning from real call recordings and conversion logs.
Days 31-60 — Typical Revenue Impact
Cumulative new leads captured
18-38/mo
Reactivated customers (cumulative)
28-70
Estimated revenue added (month 2)
$4,200-$9,500
Ranges represent small service businesses with 150-500 customer histories and 20-50 monthly inbound leads.
Days 61-90: The ROI Phase
Month three is where the math changes. Multiple compounding effects converge simultaneously: organic call volume from improved Google ranking, a tuned follow-up system converting at peak efficiency, a reactivation list that has been worked twice, and SEO content beginning to index. The revenue added per dollar of automation cost hits its highest point.
Google Maps ranking improvement drives organic call lift.
Businesses that generated 15-25 new reviews in the first 60 days see measurable Google Maps position improvements in month three. A move from position 5 to position 2 in the local 3-pack can increase organic call volume by 40-70%. This is entirely new traffic — not paid, not re-targeted, but organic intent-driven calls from people actively searching for your service right now. At this point, the AI voice employee's after-hours capture rate starts applying to a larger total call volume.
AI voice employee hits peak performance on a calibrated script.
By day 60-90, the AI voice employee's conversation logic has been refined based on two months of call recordings. Common objections are pre-empted. The booking flow is frictionless. After-hours capture rates that started at 55-60% in month one typically reach 75-85% by month three as the script handles edge cases that appeared in the first two months. Every percentage point of improvement at higher total call volumes means more revenue.
SEO content generates first organic search leads.
Blog content and FAQ schema published in weeks 2-4 begins ranking for long-tail search queries by day 60-90. These are not high-volume terms — but they are high-intent. A page ranking for 'emergency HVAC repair Charlotte NC' or 'dental implants cost Charlotte NC' attracts people actively ready to buy. First organic search leads from content typically appear at day 75-90 and grow consistently from there.
Reactivation list is fully worked — repeat business begins.
By day 90, your initial dormant customer list has been through multiple touchpoints. Customers who reactivated in month one are now returning for follow-up visits or referring friends. The reactivation revenue is no longer one-time — it is converting dormant customers into active regulars with lifetime value that compounds beyond the 90-day window.
Days 61-90 — Typical Revenue Impact
Organic call volume lift
+25-55%
System-wide conversion rate vs. Day 1
+35-60%
Estimated revenue added (month 3)
$7,500-$18,000
Month 3 figures include compounding SEO lift, peak-calibrated follow-up, and organic call volume gains from improved Google ranking.
30-60-90 Day AI Marketing Automation ROI Benchmarks
The table below aggregates results across Leadra.io client deployments in dental, HVAC, home services, and professional services. Ranges represent the lower and upper bounds for businesses with 150-500 existing customer records and 20-60 monthly inbound leads. Lower-volume businesses fall near the floor; higher-volume businesses exceed the ceiling.
| Metric | Day 30 | Day 60 | Day 90 |
|---|---|---|---|
| Added leads captured/mo | 6-15 | 18-38 | 28-55 |
| Reactivated customers | 12-30 | 28-70 | 45-100 |
| Google review count added | 8-15 | 20-35 | 35-60 |
| AI follow-up conversion rate | Baseline +18% | Baseline +28% | Baseline +40% |
| Monthly revenue added | $1,800-$5,200 | $4,200-$9,500 | $7,500-$18,000 |
| Automation ROI | 1.5x-4x | 3.5x-7x | 5x-12x |
Case Study: Charlotte NC Dental Practice Hits 9.2x ROI by Day 88
Client Story — Charlotte, NC
A two-chair dental practice in south Charlotte came to Leadra.io with a specific frustration: their Google Ads were generating 35-40 calls per month, but new patient bookings were averaging only 9-11 per month. They knew leads were getting lost — they just could not figure out where. Their front desk was overwhelmed and rarely picked up calls after 4:30 PM.
Leadra.io deployed four components: an AI voice employee covering all after-hours and overflow calls, an instant SMS follow-up sequence for web form inquiries, a patient reactivation campaign targeting 280 patients who had not returned in over 18 months, and an automated post-visit review request. Total investment: $1,050/month.
By day 30, new patient bookings jumped from 9 to 15 per month — 6 additional patients, mostly from after-hours call recovery. The reactivation campaign had a 13% response rate, bringing back 36 dormant patients in the first 30 days. By day 60, the practice had 44 new Google reviews (up from 22) and moved from position 6 to position 3 in the Google Maps 3-pack for "dentist Charlotte NC." By day 88, new patients were averaging 21 per month — a 133% increase over baseline. Monthly revenue added to baseline: $9,660 against $1,050 in automation cost. ROI: 9.2x.
New patients/month
Google reviews
Google Maps position
90-day ROI
The dental practice result follows a consistent pattern: the biggest gains come not from new marketing spend but from recovering leads that were already being generated and lost. The AI voice employee alone — answering after-hours calls — added 4-6 new patients per month. The reactivation campaign added another 4-6 in the first 90 days. The review automation moved the Google Maps ranking, adding organic inbound on top of paid. See more dental practice AI marketing results.
The 47-Day Quit Problem — and Why It Destroys ROI
In practice, the businesses that do not see strong AI marketing automation ROIshare a common failure mode: they evaluate results at day 30-45, see month-one numbers that look modest, and cancel. They are measuring at the worst possible moment — before the reactivation campaign finishes its second wave, before Google review improvements translate to ranking changes, and before the tuned follow-up system hits peak conversion.
Month-one revenue added ($1,800-$5,200 on average) is real. But it represents only the first layer of a four-layer return. Businesses that quit at day 45 experience a 1.5x-4x ROI and call it disappointing. Businesses that stay through day 90 experience 5x-12x ROI and extend the contract. The difference is entirely timing, not system performance.
The right evaluation checkpoint is day 90 — not day 30. If you are not seeing at least 5x ROI by day 90 on a full-stack deployment (voice employee, follow-up, reactivation, review automation, and content), something in the system needs fixing. At Leadra.io, that is when we do a full audit and adjust. But at day 30? Month-one numbers are the foundation, not the verdict. See the complete AI marketing automation ROI breakdown.
How to Set Realistic 90-Day ROI Expectations for Your Business
Before you start, run through these four inputs. They determine where your results will fall within the benchmark ranges.
Your average transaction value.
High-ticket businesses (dental: $1,400+ per patient, HVAC: $1,600+ per job) hit the upper ROI ranges because each recovered lead is worth more. Lower-ticket businesses (salons at $80/visit, pizza restaurants at $40/order) land at the floor. If your average transaction value is under $200, AI marketing automation ROI will be positive but closer to 3x-5x than 8x-12x.
Your existing lead volume.
The fastest ROI comes from businesses already generating 20+ inbound leads per month and losing 30-50% of them. AI automation works best as a conversion optimizer, not a lead generator. If you are generating under 10 leads per month, the reactivation campaign becomes the primary driver and you need a larger dormant list (200+ customers) to see strong month-one numbers.
The size of your reactivation pool.
Your dormant customer list (people who bought from you 12-36 months ago but have not returned) is typically your largest source of month-one revenue. Export this list before you start. A list of 300+ dormant customers at a 10-12% reactivation rate adds 30-36 returning customers in the first 60 days. A list of 50 customers adds 5-6. Size matters.
Your starting Google review count and rating.
Businesses starting with under 30 reviews or below a 4.2 rating see the fastest Google ranking improvements from review automation because there is more ground to gain. Businesses already at 4.8 with 200+ reviews will see smaller organic ranking lifts but still benefit from review velocity as a ranking maintenance signal. The reactivation and follow-up layers matter more for already-established businesses.
Frequently Asked Questions
How long does it take to see ROI from AI marketing automation?
Most small businesses see the first measurable ROI from AI marketing automation within 30 days — primarily from lead capture improvements and after-hours call recovery. The full return, including reactivation revenue and compounding SEO lift, typically materializes by day 60-90. Businesses that quit before 90 days miss the compounding phase where multiple automation layers reinforce each other.
What happens in the first 30 days of AI marketing automation?
In the first 30 days, the primary gains come from stopping lead leakage: AI voice employees answer after-hours calls, instant SMS follow-up fires within seconds of form submissions, and the first customer reactivation campaign goes out to dormant leads. Most businesses add $1,800-$5,200 in recoverable revenue in month one — not from new ad spend, but from capturing leads they were already generating and losing.
What ROI percentage should I expect from AI marketing automation by 90 days?
By day 90, most small service businesses see 5x-12x ROI on their AI marketing automation investment. The range depends on average transaction value, existing lead volume, and reactivation pool size. High-ticket businesses like dental practices and HVAC companies consistently reach the upper end (8x-12x). Lower-ticket businesses average 4x-6x by day 90.
Why do some businesses not see ROI from AI marketing automation?
The most common reason is quitting before the compounding phase, typically around day 45-60. The second most common reason is deploying a single tool in isolation — like only adding a chatbot — instead of building a system that covers the full lead lifecycle: capture, follow-up, reactivation, and review generation. Each layer multiplies the others; one tool alone rarely moves the needle enough to justify the investment.
The Bottom Line
AI marketing automation ROI is real — but it is phase-dependent. Month one captures the low-hanging fruit: after-hours leads, instant follow-up, and the first reactivation wave. Month two builds momentum as review velocity starts moving Google rankings and the follow-up system gets optimized. Month three delivers the full compounding return: 5x-12x ROI with multiple revenue layers running simultaneously.
The businesses that do not see these results are not running bad automation. They are measuring at the wrong time. The 90-day commitment is not a sales pitch — it is the minimum window required for the compounding effects to show up in your revenue report.
At Leadra.io, we build full-stack AI marketing automation systems for small businesses across Charlotte, NC and the US — covering lead capture, follow-up, reactivation, review generation, and SEO. Our guarantee: 90 new clients in 90 days for qualifying practices, or you do not pay. See AI marketing automation ROI benchmarks by industry.
Find Out What's Realistic for Your Business
Get Your 90-Day ROI Projection
We'll walk through your current lead volume, reactivation pool, and Google ranking — and give you a specific revenue projection for your first 30, 60, and 90 days. 15-minute call, no commitment.
Last updated: June 28, 2026 | Leadra.io — AI Marketing Automation ROI Timeline for Small Businesses